Table of Contents
Introduction: The “Content Decay” Crisis
You just spent 6 hours writing the perfect article. You researched the data, polished the headlines, and hit “Publish.”
What happened next?
Maybe 200 views. A few likes. And then… silence.
It’s heartbreaking, but in 2025, it’s the reality. The internet has stopped reading and started scrolling. On platforms like LinkedIn, Instagram, and even X (Twitter), visual content receives 3x to 5x more engagement than text-only posts. The algorithm gods favor images that stop the scroll.
But here is the bottleneck: You are a writer, not a designer. You don’t have time to fiddle with Canva layers for 2 hours just to make one image. And you certainly don’t have the budget to pay a designer $150 for every single Instagram post.
This is where the AI Infographic Generator revolution changes the game.
The New Workflow: “Text-to-Insight” Automation
Forget about “Prompt Engineering” for a moment. The real power of next-gen AI tools like a.graphics lies in “Content Repurposing.”
We call it the “60-Second Recycling Workflow.” It allows you to take that blog post you already wrote and instantly transform it into a suite of high-performing visual assets. But strong visuals alone are not enough. The captions, headlines, and descriptions that go with them often end up sounding flat or overly AI-generated when created quickly at scale. Before publishing across different platforms, creators may take an extra step to convert robotic text into human-like content so the messaging feels as engaging and authentic as the visuals themselves.
Here is exactly how to do it using the a.graphics Visual Logic Core™.
Step 1: Identify Your “Visual Hooks”
Don’t try to visualize the whole article. Scan your text for these three triggers:
- A Process: “Step 1, Step 2, Step 3…”
- A Comparison: “Traditional way vs. New way.”
- A Stat: “80% of users prefer…”
These are your seeds.
Step 2: The “Process” Hook (Great for Pinterest/How-to)
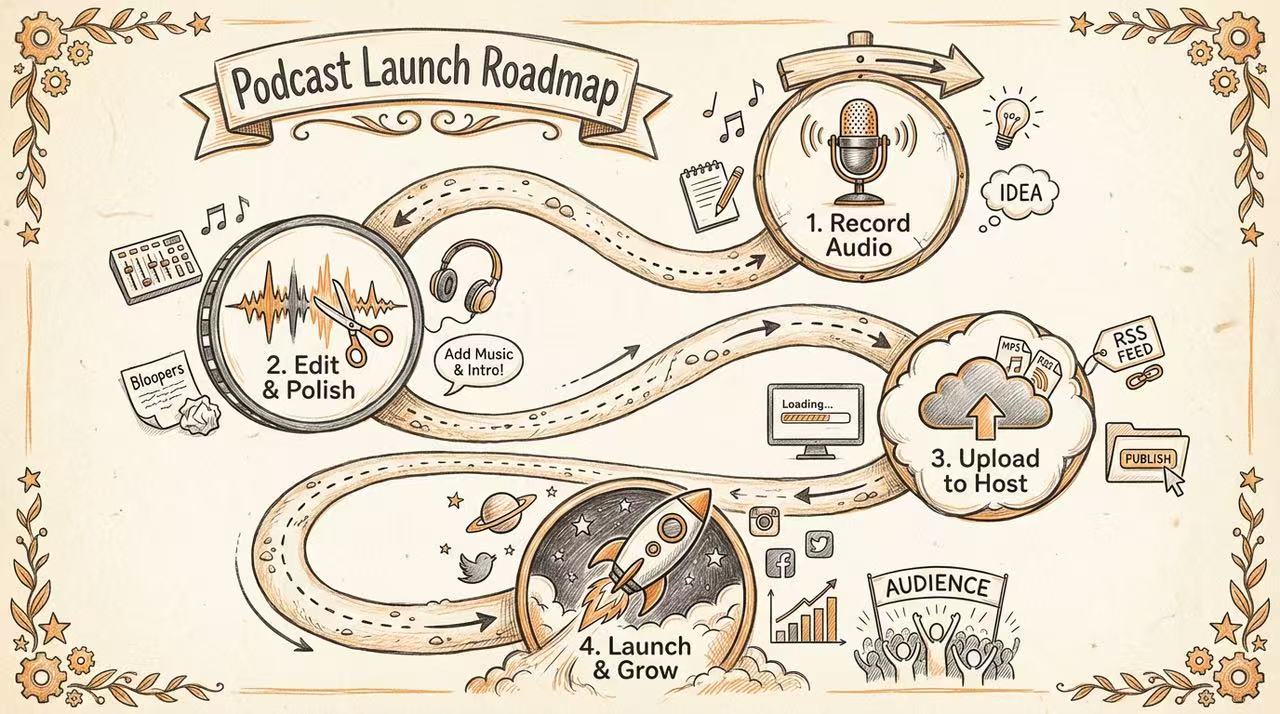
Let’s say your article is about “Launching a Podcast.” Instead of writing a long paragraph, feed the steps into a.graphics with the Education scenario selected.
The Prompt:“Create a vertical flowchart showing the 4 steps to launch a podcast: Record, Edit, Host, Promote.”
The AI doesn’t just draw; it reasons. It understands that “Record” implies a microphone icon and “Promote” implies a megaphone. It arranges them logically from top to bottom.
Step 3: The “Comparison” Hook (Great for LinkedIn/B2B)
Comparison posts are engagement bait. People love to take sides.
If your article compares “Email Marketing vs. Social Media,” turn that section into a split-screen battle card.
The Prompt:“Create a split-screen comparison infographic. Left: Email (High ROI). Right: Social (High Reach).”
Because a.graphics operates on a Subscription Model, you can generate 5 different variations of this comparison (Neon style, Business style, Minimalist style) without worrying about “wasting credits.”
Step 4: The “Data” Hook (Great for X/Reports)
Have a boring Excel sheet in your article? Use the Search Grounding feature or paste your data. The Prompt:“Visualize this data as a bar chart: Q1 $10k, Q2 $15k, Q3 $25k.”
The AI handles the spacing, the axis labels, and the color coding. You get a chart that looks like it came from a Wall Street Journal report, ready to be embedded in your newsletter.
Why “Subscription” is the Secret Weapon for Creators
Here is the truth about AI tools: The first result is rarely perfect. If you are paying $0.50 per image (the old “Pay-as-you-go” model), you hesitate. You settle for “good enough.”
But with a.graphics Pro, you have an unlimited creative sandbox.
- Don’t like the color? Regenerate.
- Want it in dark mode? Regenerate.
- Want to turn that list into a mind map? Regenerate.
This freedom allows you to create Volume. You can create a week’s worth of social media content (7 images) in about 10 minutes. That is the leverage of Logic-First AI.
Conclusion: Visuals are the New Headlines
Your content is valuable. Don’t let it die in a text block. By adding an AI Infographic Generator to your stack, you aren’t just making pretty pictures—you are building a Content Recycling Engine that multiplies your traffic.
Stop writing for bots. Start designing for humans.Start your Unlimited Design Workflow at a.graphics
Leave a Reply